WASDE (Mar 10, 2026) — Full Report Trading Bias (WASDE-669)
Focus: What changed vs. last month, why it matters, and a practical directional bias for the key tradable markets (Futures + CFD mapping for Pepperstone / Capital.com).
Headline Bias Board
How to Read This
- Bullish = net tighter supply / stronger demand / price support (WASDE logic).
- Bearish = looser balance sheet / weaker demand / price headwind.
- Mixed = conflicting drivers; wait for price confirmation.
Practical Trading Note
March is often a confirmation month rather than a “shock month”. In WASDE-669, most U.S. balance sheets stayed unchanged, so relative strength and confirmation via price action matter more than trading the headline alone.
Trading Products & Symbol Mapping (Futures + CFDs)
Futures tickers below use the common TradingView continuous format (CBOT:ZC1! etc.). CFD symbols are what you’ll typically find directly in TradingView search for each broker (availability can vary by region/account).
| Market | Futures (CME/ICE) | TradingView Futures | Pepperstone (CFD) | Capital.com (CFD) |
|---|---|---|---|---|
| Wheat | CBOT Wheat ZW |
CBOT:ZW1! |
PEPPERSTONE:WHEAT |
CAPITALCOM:WHEAT |
| Corn | CBOT Corn ZC |
CBOT:ZC1! |
PEPPERSTONE:CORN |
CAPITALCOM:CORN |
| Soybeans | CBOT Soybeans ZS |
CBOT:ZS1! |
PEPPERSTONE:SOYBEANS |
CAPITALCOM:SOYBEAN |
| Soybean Meal | CBOT Meal ZM |
CBOT:ZM1! |
— (usually not offered) | CAPITALCOM:SOYBEANMEAL |
| Soybean Oil | CBOT Oil ZL |
CBOT:ZL1! |
— (usually not offered) | — (check availability) |
| Rough Rice | CBOT Rice ZR |
CBOT:ZR1! |
— | CAPITALCOM:RR |
| Cotton | ICE Cotton #2 CT |
ICEUS:CT1! |
PEPPERSTONE:COTTON |
CAPITALCOM:USCOTTON |
| Sugar | ICE Sugar #11 SB |
ICEUS:SB1! |
PEPPERSTONE:SUGAR |
CAPITALCOM:SB |
| Live Cattle | CME Live Cattle LE |
CME:LE1! |
PEPPERSTONE:CATTLE |
CAPITALCOM:LIVECATTLE |
| Feeder Cattle | CME Feeder GF |
CME:GF1! |
— | CAPITALCOM:FEEDERCATTLE |
| Lean Hogs | CME Hogs HE |
CME:HE1! |
— | CAPITALCOM:LEANHOGS |
Note: Availability can differ by jurisdiction and account settings. If a CFD ticker doesn’t resolve in TradingView, search your broker’s symbol list (some use different naming like “WHEATUSD” etc.).
February vs March — What Changed?
Quick month-over-month comparison for the core balance sheet items (Feb vs Mar columns inside WASDE-669 tables). This section follows the same structure as your February article and highlights where revisions actually occurred.
Corn (ZC)
- Production (mbu): 17,021 → 17,021 flat
- Exports (mbu): 3,300 → 3,300 flat
- Ending Stocks (mbu): 2,127 → 2,127 flat
- Farm Price ($/bu): 4.10 → 4.10 flat
Soybeans (ZS)
- Imports (mbu): 20 → 25 ▲ +5
- Crush (mbu): 2,570 → 2,575 ▲ +5
- Ending Stocks (mbu): 350 → 350 flat
- Farm Price ($/bu): 10.20 → 10.20 flat
Wheat (ZW)
- Production (mbu): 1,985 → 1,985 flat
- Exports (mbu): 900 → 900 flat
- Ending Stocks (mbu): 931 → 931 flat
- Farm Price ($/bu): 4.90 → 4.95 ▲ +0.05
Trader takeaway: March is another “small revision” month. U.S. Corn is unchanged, Wheat only gets a modest farm-price lift, and Soybeans see a small increase in imports and crush but no change in ending stocks. The cleaner signals this month come more from the global tables than the U.S. headline numbers.
Post-WASDE Confirmation — Grain Complex Relative Performance
The chart below compares the percentage performance of Corn, Soybeans and Wheat around the March WASDE release. This is the fastest way to validate whether the balance-sheet narrative translates into real flows.
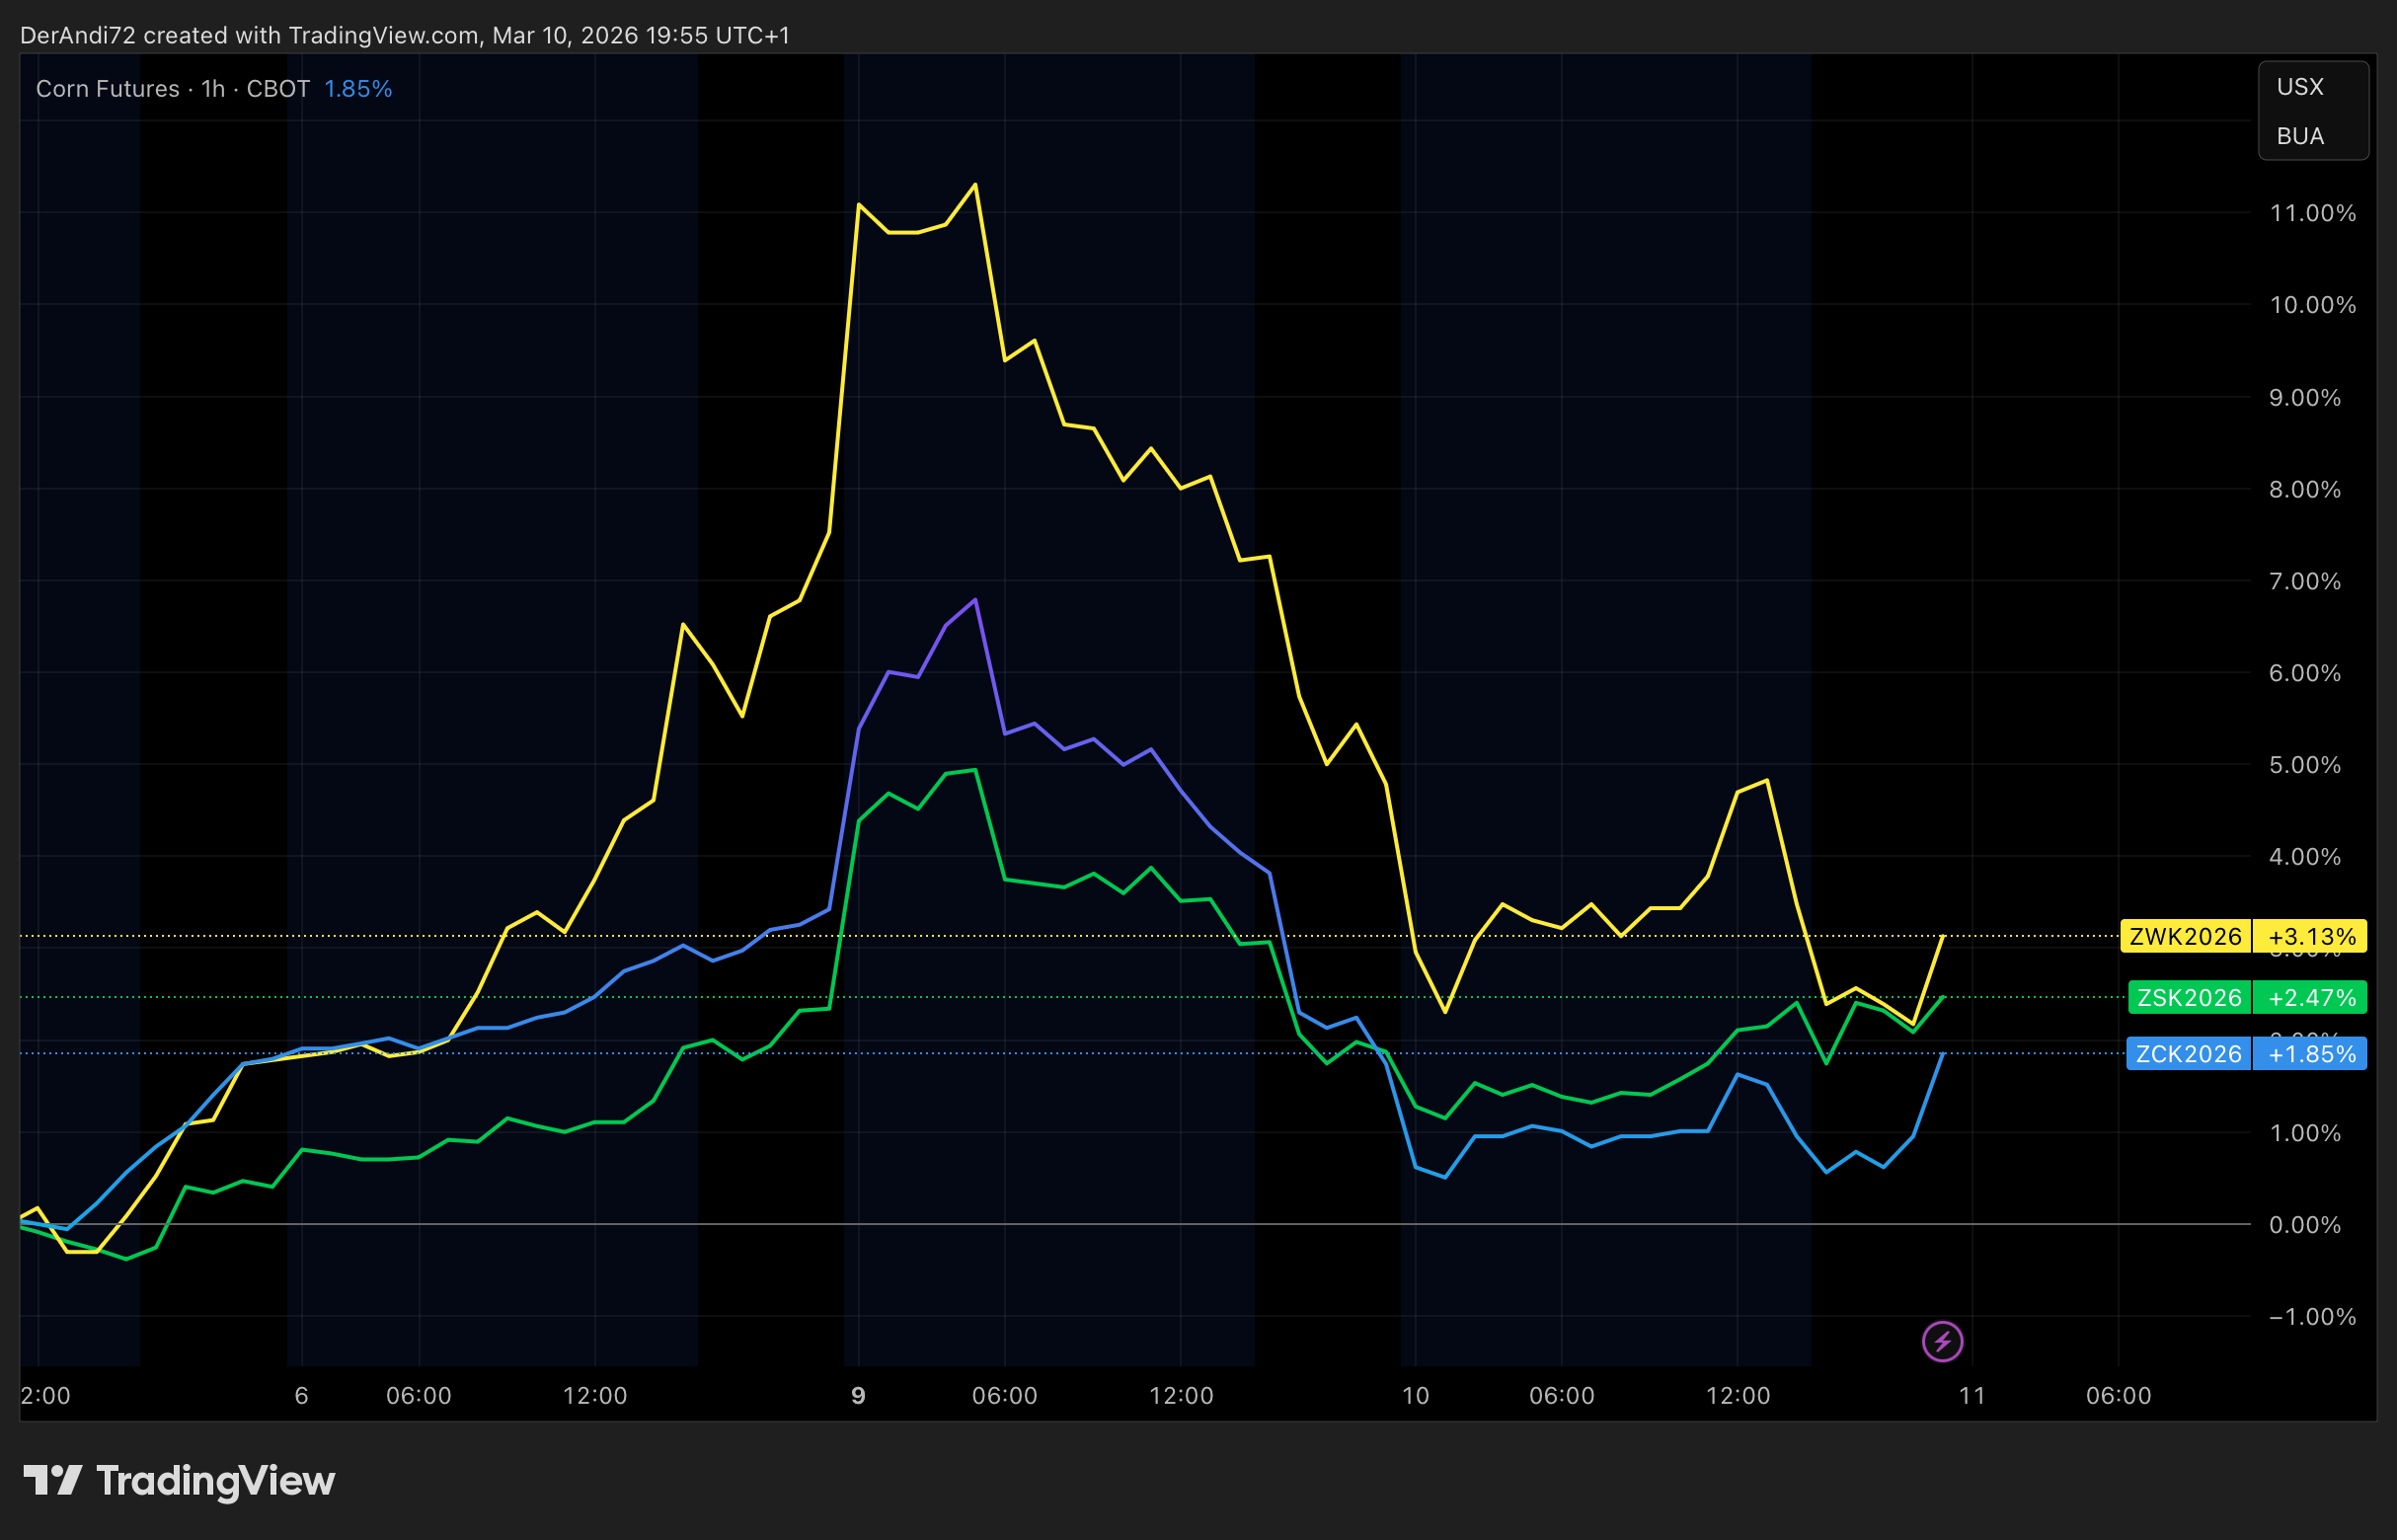
- Corn staying flat = unchanged U.S. balance sheet, no fresh tightening signal.
- Soybeans lagging = global South America supply still caps upside despite unchanged U.S. ending stocks.
- Wheat stability = modest support from stronger global consumption and a small farm-price increase.
Wheat — Neutral ▶
What changed (U.S.)
- Production: 1,985 mbu (unchanged)
- Exports: 900 mbu (unchanged)
- Ending stocks: 931 mbu (unchanged)
- Farm price: $4.90 → $4.95/bu
Global angle
- Production: 841.80 → 842.12 Mt
- Consumption: 824.06 → 824.80 Mt
- Ending stocks: 277.51 → 276.96 Mt
Trading interpretation
March is slightly supportive for Wheat on the global side, but the U.S. balance sheet is unchanged and world ending stocks remain a 5-year high. That keeps the overall read neutral rather than outright bullish.
Trading Products: CBOT:ZW1! • PEPPERSTONE:WHEAT • CAPITALCOM:WHEAT
Corn — Neutral ▶
What changed (U.S.)
- Production: 17,021 mbu (unchanged)
- Exports: 3,300 mbu (unchanged)
- Ending stocks: 2,127 mbu (unchanged)
- Farm price: $4.10/bu (unchanged)
Global angle
- World corn production: 1,295.91 → 1,297.44 Mt
- World ending stocks: 288.98 → 292.75 Mt
- Key drivers: Brazil +1.0 Mt, Ukraine +1.7 Mt, Argentina −1.0 Mt
Trading interpretation
The U.S. sheet is unchanged, but globally this is a slightly looser corn report. Higher world production and ending stocks offset the supportive February tightening story. That keeps Corn neutral this month rather than bullish.
Trading Products: CBOT:ZC1! • PEPPERSTONE:CORN • CAPITALCOM:CORN
Soybeans — Bearish ▼
What changed (U.S.)
- Imports: 20 → 25 mbu
- Crush: 2,570 → 2,575 mbu
- Ending stocks: 350 mbu (unchanged)
- Farm price: $10.20/bu (unchanged)
Global angle
- World production: 428.18 → 427.18 Mt
- World exports: 187.57 → 187.17 Mt
- World ending stocks: 125.51 → 125.31 Mt
Trading interpretation
Even though global soybean stocks were trimmed slightly, the bigger story remains the same: Brazil keeps the export anchor and Argentina is still large enough to cap upside. U.S. ending stocks did not tighten, so the structural soybean view stays bearish.
Trading Products: CBOT:ZS1! • PEPPERSTONE:SOYBEANS • CAPITALCOM:SOYBEAN
Optional: CBOT:ZM1! / CAPITALCOM:SOYBEANMEAL
Rice — Neutral ▶
What changed (U.S.)
- Imports: 47.7 → 45.7 million cwt
- Exports: 87.0 → 85.0 million cwt
- Ending stocks: 50.3 → 50.3 million cwt
- Average farm price: unchanged at $12.10/cwt (total rice)
Trading interpretation
Rice softens on trade flow, but because lower imports are fully offset by lower exports, ending stocks do not change. That makes the March message more neutral than outright bearish.
Trading Products: CBOT:ZR1! • CAPITALCOM:RR (Pepperstone typically n/a)
Cotton — Neutral ▶
What changed (U.S.)
- Production: 13.92 million bales (unchanged)
- Exports: 12.00 million bales (unchanged)
- Ending stocks: 4.40 million bales (unchanged)
- Farm price: 60.0 c/lb (unchanged)
Global angle
- World production: 119.86 → 120.99 million bales
- World use: 118.72 → 118.58 million bales
- World ending stocks: 75.11 → 76.39 million bales
Trading interpretation
The U.S. balance sheet is unchanged, but the world sheet is looser: production rises, use slips a little, and ending stocks move higher. That is enough to remove a bullish case, but not enough for a strong bearish call, so neutral fits best.
Trading Products: ICEUS:CT1! • PEPPERSTONE:COTTON • CAPITALCOM:USCOTTON
Sugar — Bullish ▲
What changed (U.S.)
- Production: 9,410 → 9,280 STRV
- Imports: 2,243 → 2,427 STRV
- Food deliveries: 12,048 → 12,165 STRV
- Ending stocks: 1,940 → 1,878 STRV
- Stocks-to-use: 15.89% → 15.24%
Trading interpretation
This is the cleanest bullish revision in the report: even with higher imports, stronger human consumption pulls ending stocks down and tightens the stocks-to-use ratio. That keeps Sugar as the strongest bullish WASDE read this month.
Trading Products: ICEUS:SB1! • PEPPERSTONE:SUGAR • CAPITALCOM:SB
Livestock & Dairy — Supply Up / Prices Mixed
What changed (2026)
- Beef production: 25,987 → 25,877 million lbs (lower)
- Pork production: 28,289 → 28,289 million lbs (unchanged)
- Total red meat production: 54,444 → 54,332 million lbs (slightly lower)
- Broiler production: 47,981 → 48,179 million lbs (higher)
The text of the report points to higher broiler production more than offsetting lower beef and turkey. Broader protein supply remains ample, even if red meat alone was trimmed slightly in the detailed table. For trading purposes, the overall meat complex still reads as a supply-heavy backdrop.
Trading Products: CME:LE1! / PEPPERSTONE:CATTLE / CAPITALCOM:LIVECATTLE
Optional: CME:GF1! / CAPITALCOM:FEEDERCATTLE • CME:HE1! / CAPITALCOM:LEANHOGS
What changed (2026 prices)
- Class III: 16.65 → 16.65 (unchanged)
- Class IV: 15.70 → 17.15 (raised)
- All Milk: 18.95 → 19.70/cwt (raised)
Milk production is slightly higher, but stronger butter and NDM pricing lift Class IV and the all-milk price forecast. That is constructive, but because production also increased, a neutral-to-constructive dairy read is more balanced than a full bullish call.
Day-0 Execution Checklist (WASDE Day)
- Expect spikes: reduce size or widen stops if you trade the release window.
- Trade confirmation: let the first impulse print, then take continuation/reclaim setups.
- Use the complex: Corn vs Beans often gives cleaner relative-value signals than outright.
- Re-entry rule: if stopped by volatility, prefer a rule-based trigger (reclaim range / break & hold).